Designing a GNSS project quality dashboard
A useful dashboard makes review status and evidence visible without turning receiver indicators into unsupported accuracy claims.
Start with decisions the dashboard should support
A GNSS quality dashboard should help staff decide what is accepted, what needs review and what action comes next. Begin with those decisions rather than collecting every available receiver field into one screen. The useful view depends on the project: control establishment, asset mapping and continuous station operation have different workflows. Define the users, authoritative data sources and responsibility for resolving exceptions before choosing charts or status colors.
Keep the distinction between measurement quality, completeness and workflow status. A point can be fully collected but unreviewed, or technically sound but missing a required photograph. A station can be connected while delivering incomplete observations. Combining these conditions into one unexplained green score can hide important weaknesses. The dashboard should make separate questions visible and explain how they relate to final acceptance.
Continue learning Local site calibration: connecting GNSS to project coordinates
Define indicators with units and meaning
For every indicator, record its source, definition, units, time basis and interpretation. Receiver precision fields can use different confidence conventions, while correction age and observation completeness describe other aspects of operation. A number becomes useful when the reviewer knows what it measures and what it does not. Avoid renaming a formal precision value as verified accuracy unless the evidence and definition genuinely support that claim.
Use consistent coordinate framework metadata. A dashboard comparing check discrepancies must know that the observed and reference coordinates are compatible. Include reference frame, height convention and relevant transformation version in the data model. Otherwise the screen may rank points by apparent error while actually comparing incompatible quantities. A well designed indicator depends on sound inputs as much as on a clear visual presentation.
Continue learning A traceable workflow for reviewing GNSS outliers
Separate automatic flags from review decisions
Automatic rules can identify missing fields, failed comparisons or unusual patterns. They should create review items, not silently approve or delete observations beyond their intended role. Define which rules are mechanical, such as a missing antenna height, and which require professional judgment. Preserve the rule version so a later change does not make historical status appear inconsistent without explanation.
Give each exception an owner, evidence link, status and next action. A red symbol without a resolution path creates noise. A review queue that identifies the affected point, reason, supporting records and required action supports real work. Keep the original observation and the final disposition linked, allowing users to distinguish corrected, repeated, excluded and unresolved cases rather than treating all closed items as identical.
Continue learning Designing GIS field forms for GNSS surveys
Show independent checks explicitly
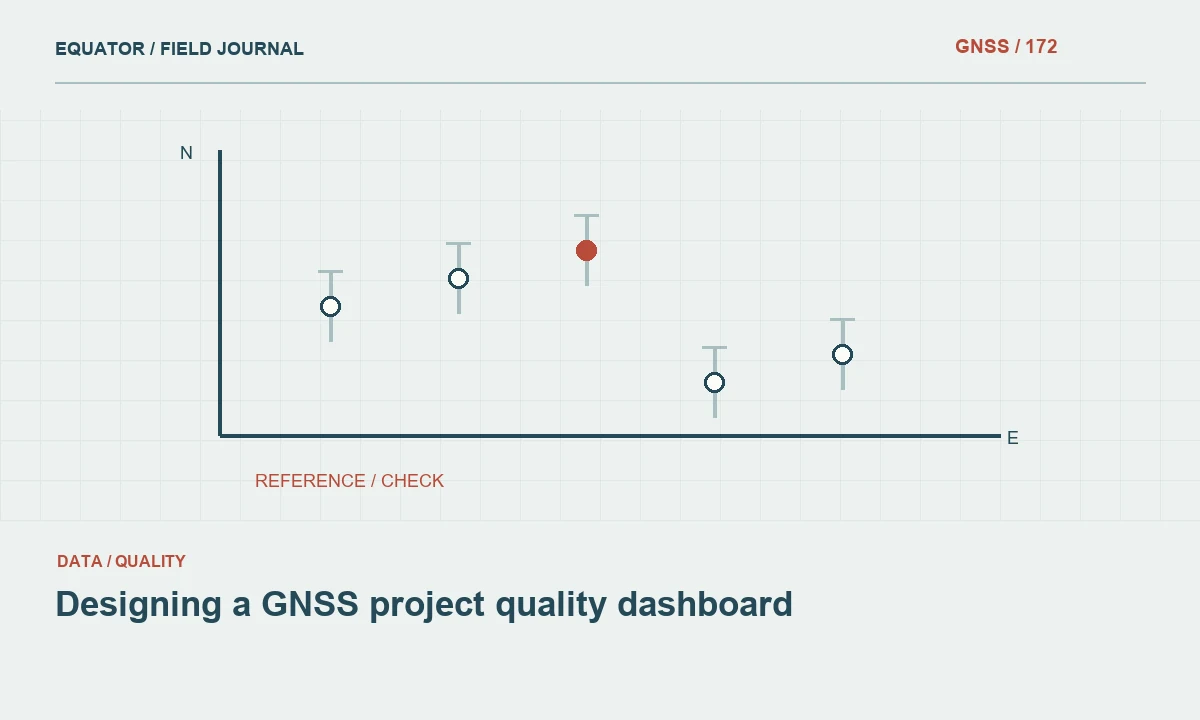
Provide a view of control checks and repeated occupations with their roles clearly labeled. Distinguish points used to determine a transformation from independent verification points. Show signed horizontal components and height differences where useful, together with the reference and observation conditions. A single absolute magnitude can conceal a common directional shift or a vertical pattern that deserves investigation.
Include sample coverage. A project with excellent checks at three open marks may still have many difficult features that were never independently tested. A map or grouped summary can show which environments and areas the evidence represents. The dashboard should support a conclusion proportional to that coverage, rather than imply that a favorable average establishes uniform performance everywhere in the dataset.
Continue learning Building a GNSS error budget before fieldwork
Make time and configuration changes visible
Link observations to timestamps, receiver configuration, correction source and relevant project template versions. Changes in behavior can then be compared with changes in the measurement chain. A rise in exceptions after a firmware update or service switch is a useful investigation lead. Without configuration history, the dashboard may display a trend while leaving staff unable to determine whether the cause is environmental, operational or computational.
For continuous stations or trajectories, preserve quality through time rather than only a daily average. Short gaps and degraded intervals can matter to users even when the overall summary looks strong. Identify missing data separately from zero values and record delayed delivery. A chart should not draw a reassuring continuous line across periods for which no observations were received.
Continue learning Local site calibration: connecting GNSS to project coordinates
Design summaries that do not hide exceptions
Use counts and proportions with clear denominators. Accepted points out of reviewed points answers a different question from accepted points out of all required points. Report both completeness and review progress where appropriate. A high acceptance percentage can look impressive while many unreviewed observations remain outside the calculation. Make that distinction visible enough that managers do not mistake review selection for project quality.
Avoid a composite score unless its construction and limitations are clearly justified. Different issues can have very different consequences, and averaging them can make a serious control problem disappear among many minor successes. A concise set of interpretable indicators is often more useful than one numerical grade. Keep critical unresolved dependencies prominent regardless of how favorable the rest of the dashboard appears.
Continue learning A traceable workflow for reviewing GNSS outliers
Connect the dashboard to source evidence
Allow authorized reviewers to reach the observation, setup record, processing report and exception history behind a summary. Stable identifiers are essential. A chart without traceable source data can support discussion but not a defensible acceptance decision. Keep issued versions linked to the exact review state that approved them, rather than always displaying only the latest working data.
Protect secrets and unnecessary personal information. Correction credentials, SMTP passwords and private access tokens have no role in a public or broadly shared quality view. Apply access appropriate to the project and retain an audit record of significant status changes. The dashboard should make evidence easier to use without exposing operational details that are irrelevant to the recipient's decision.
Continue learning Designing GIS field forms for GNSS surveys
Test the dashboard with realistic review tasks
Ask a reviewer to find a point with an unexplained height discrepancy, identify the relevant setup and record a disposition. Ask a project lead to determine whether a deliverable is ready for issue. Ask an operator to identify which observations need recollection. These tasks reveal whether the interface supports the workflow more effectively than a visual review of attractive charts alone.
Test missing, delayed and inconsistent inputs. A robust dashboard should show uncertainty or unavailable information honestly rather than substitute a default success state. Verify calculations against a small known dataset and document the rules. When definitions change, assess their effect on historical summaries. This keeps the tool's apparent precision from exceeding the reliability of the underlying data and processing logic.
Continue learning Building a GNSS error budget before fieldwork
Use the dashboard as a review aid
The final acceptance process should remain tied to the project's method and responsible review roles. A dashboard can organize evidence and highlight patterns, but it does not create independent measurement verification. Preserve the underlying records and provide a readable export or report that identifies the approved dataset and remaining limitations. A status screen alone may not be sufficient for long term handover.
An effective GNSS quality dashboard makes the right questions easier to answer. It separates observation indicators from independent checks, shows missing evidence and connects exceptions to action. That clarity helps crews and reviewers improve the dataset while avoiding the misleading impression that a green interface or a single score can certify every coordinate automatically.
Continue learning Local site calibration: connecting GNSS to project coordinates
Practical checklist
- Start with decisions the dashboard should support.
- Test the dashboard with realistic review tasks.
- Use the dashboard as a review aid.
Plan your GNSS setup
Compare the EQ10 and EQ20 receiver specifications, then discuss the configuration and support your project needs.
Compare GNSS receivers