GNSS coastal survey control: linking land observations and height references
Plan stable coastal control while distinguishing ellipsoidal heights, land elevation datums, tide references and changing shorelines.
Define the coastal survey purpose
Coastal control may support shoreline mapping, infrastructure planning, erosion studies or the connection between land and hydrographic datasets. Identify the intended use and responsible reference authority before selecting observation methods. A position framework for a beach map does not by itself establish a tidal datum or a safe depth reference for navigation.
Agree the survey boundary, observation period and physical features to be represented. A shoreline can mean a visible water edge at a particular time, a vegetation line or another defined indicator. These are different objects. The field record should state which indicator was observed so later comparisons do not interpret changes in definition as physical coastal change.
Continue learning GNSS corridor surveys: controlling a long, changing work area
Keep height references explicit
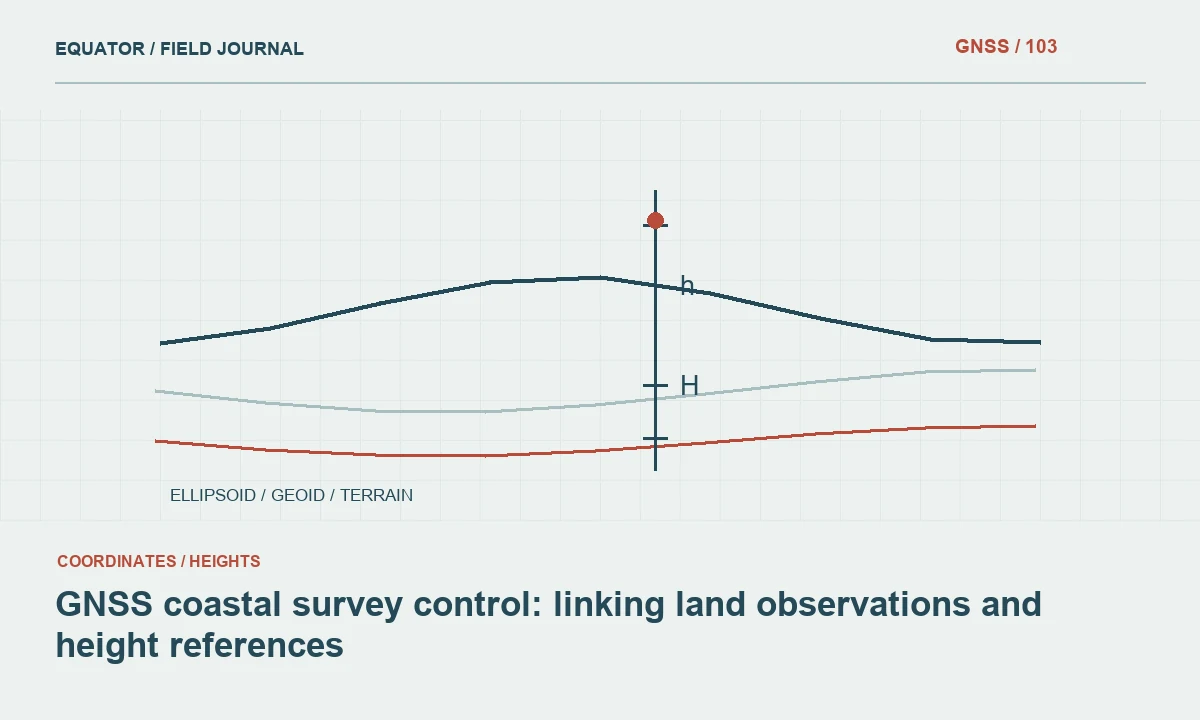
GNSS commonly provides ellipsoidal height before a geoid or other vertical operation is applied. Coastal projects may also involve a national land datum, a local benchmark or a tidal reference. Record the relationship required by the project rather than treating every value labelled elevation as equivalent. A water level observed at one moment does not automatically define a tidal datum.
Obtain approved transformations and benchmark information from the responsible project or reference authority. Document model names, versions, units and the area of applicability. If a relationship between land and tide references is uncertain, report that uncertainty clearly. Do not hide an unexplained difference through an arbitrary constant shift applied to make coastal datasets appear to align.
Continue learning GNSS control for bridge approaches and connecting roads
Select marks outside likely coastal disturbance
Choose control locations with attention to erosion, sand movement, flooding, construction and access. A mark in loose beach material may not provide the long-term stability required for repeated surveys. Distinguish durable control from temporary working points and record their intended life. Include photographs and descriptions that remain useful when the local appearance changes.
Plan recovery routes and observation access under the expected site conditions. A stable mark that becomes inaccessible during the survey window may not serve the field workflow. Keep a status register and recheck marks after events or works identified by the responsible survey team as potentially significant. Continued visibility of the mark is not sufficient evidence that it remains undisturbed.
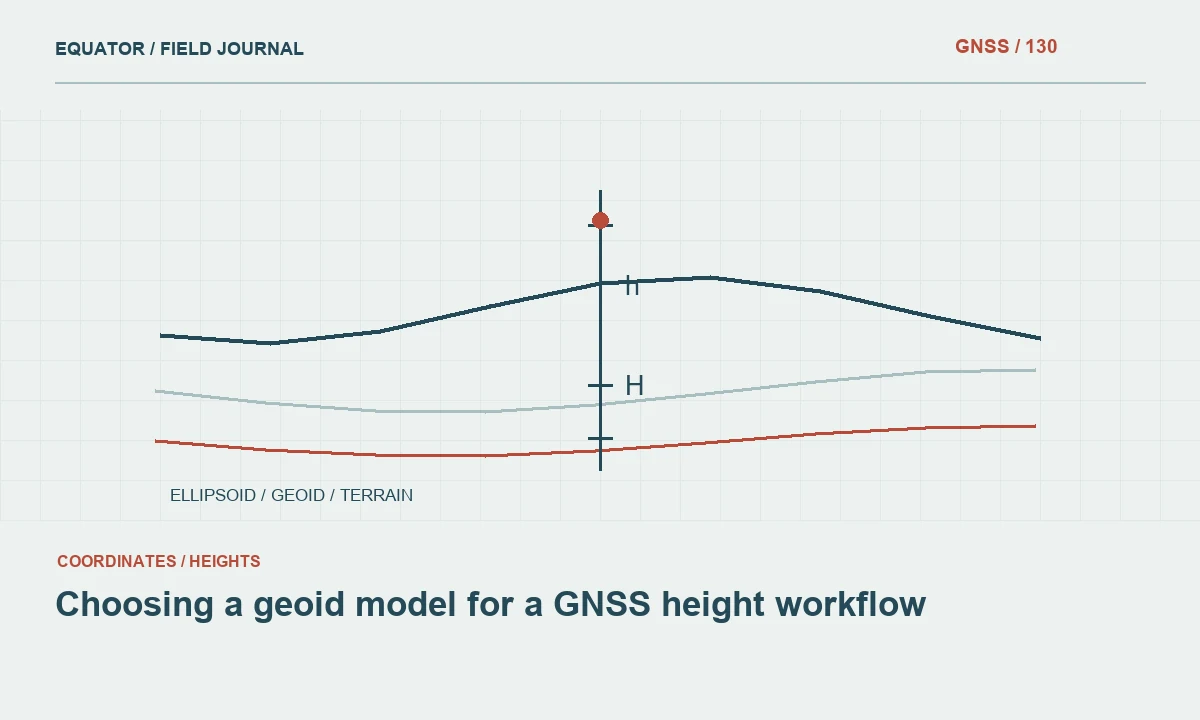
Continue learning Choosing a geoid model for a GNSS height workflow
Design observations for the coastal environment
Open sky can make coastal sites attractive for GNSS, but water surfaces, seawalls, vehicles and nearby structures can still affect signal reception. Inspect the antenna environment rather than assuming open water removes all observation problems. Record antenna type, reference point, height and setup conditions consistently. Protect equipment according to the manufacturer’s guidance and the project’s field arrangements.
Use repeated occupations and independent control comparisons as required by the survey plan. Consider whether observation timing, access or atmospheric conditions create limitations for the selected method. A fixed RTK status is one indicator, not a complete validation of the reference or height result. Where the required evidence cannot be obtained in real time, use a suitable alternative or additional processing strategy.
Continue learning Planning static GNSS occupations for project control
Record time for changing coastal features
Water edges and exposed beach surfaces can change during a single survey. Record observation timestamps and relevant environmental notes. Coordinate the collection window where comparable shoreline positions are needed. A line assembled from observations taken under substantially different conditions should not be presented as a single instantaneous water boundary without qualification.
For repeated coastal surveys, use the same feature definition and document changes in method. Retain the original observations so a later analysis can consider timing and coverage. Do not infer an erosion rate from two lines before checking their references, observation dates and shoreline indicators. Apparent movement may contain a combination of real change and differences in how the feature was observed.
Continue learning GNSS corridor surveys: controlling a long, changing work area
Connect land and other datasets carefully
When combining GNSS control with aerial imagery, terrain models or hydrographic information, verify horizontal and vertical compatibility separately. Confirm units, coordinate axes, datum realisations and the meaning of height or depth values. A common map projection does not prove that the vertical references agree. Preserve metadata from each source rather than reducing everything to a generic coastal layer.
Use independent checkpoints that are not part of the calibration or adjustment being tested. Examine their distribution and environmental setting. A few checks on stable open pavement may not describe the quality of a vegetated dune surface. The assessment should reflect the actual feature types and measurement conditions relevant to the project’s intended coastal analysis.
Continue learning GNSS control for bridge approaches and connecting roads
Review change and uncertainty honestly
Inspect spatial differences in relation to the quality of both surveys. A change map should not imply that every small difference represents real movement. Consider positioning, surface interpretation, reference transformations and observation timing. Where the project requires a quantitative uncertainty assessment, use the approved method and state its assumptions rather than inventing a universal threshold.
Separate areas of direct observation from interpolated or inaccessible areas. Review the terrain surface for triangles crossing water or unmeasured gaps. Keep shoreline indicators and control points distinguishable in the final map. A useful coastal report explains where evidence is strong, where it is limited and what additional observations would reduce the remaining uncertainty.
Continue learning Choosing a geoid model for a GNSS height workflow
Deliver a reference framework for future surveys
Provide control descriptions, coordinates, height definitions, transformation information and observation records with the map. Include the shoreline feature definition and effective survey period. Explain any relationship to tidal or hydrographic references and identify unresolved questions. This lets later teams compare observations on the same basis instead of repeating the original reference investigation.
Archive raw data where available, field notes and the versions of all models used. Preserve previous control releases when coordinates change. Repeated coastal work gains value from continuity, but only when that continuity is documented. GNSS control supports reliable coastal comparisons when spatial reference, physical feature definition and observation time remain connected throughout the workflow.
Continue learning Planning static GNSS occupations for project control
Compare two shoreline surveys cautiously
Suppose one survey follows the visible water edge in the morning and another maps a vegetation edge several months later. Their separation is not a direct erosion measurement because the observed features differ. Review the feature definitions, dates, water conditions and coordinate references before calculating displacement. If the evidence cannot support a like-for-like comparison, state that limitation rather than forcing the lines into a single change statistic.
A useful comparison may require repeating the same indicator under a defined protocol or adding another data source. Preserve the original lines and their metadata even if a derived interpretation is created. The map can show both observations with clear labels. This communicates the evidence honestly and allows a later coastal analysis to apply an appropriate interpretation without losing the details of how each line was obtained.
When publishing a change figure, keep the observed indicators visible in the legend and identify the comparison period. Use an accompanying note to explain whether the lines represent the same feature definition. If they do not, avoid a colour scheme or statistic that suggests a directly measured retreat distance. The presentation itself is part of communicating evidence. A technically correct metadata file is less helpful when the main map encourages an interpretation that the observations cannot support. Review the figure with the intended analyst before release.
Continue learning GNSS corridor surveys: controlling a long, changing work area
Practical checklist
- Define the shoreline indicator and survey time window.
- Distinguish ellipsoidal, land datum and tidal height references.
- Protect and recheck control outside mobile coastal ground.
Plan your GNSS setup
Compare the EQ10 and EQ20 receiver specifications, then discuss the configuration and support your project needs.
Compare GNSS receivers